Related articles
Summer 2025: how to predict occupancy and what to do in these 3 situations
Compare historical data with current market trends and learn how to adjust your rates in the 3 most common scenarios

Summer is the most crucial time for the hotel and short-term rental industry, and the big question many are asking is: what will summer 2025 look like?
For now, the data looks promising. And this is why, instead of waiting and wondering “how will it go?”, now is the time to act. Tracking bookings now is essential to avoid last-minute dilemmas, like lowering prices to fill rooms, and cutting into your profits, or keeping rates high but risking empty rooms.
In this article, we’ll walk through how to analyze historical booking data and compare it with current market trends to accurately forecast and optimize summer demand.
The 4 key steps to forecasting and optimizing summer occupancy
Here’s what you should do now to prepare for summer and achieve the best possible results.
1. Analyze your booking window and compare it with past data
The booking window represents the average time between a booking and the guest’s arrival. Analyzing it allows you to identify when most reservations are made.
For example: If summer bookings in 2024 started picking up significantly in March, it will be useful to monitor the same period in 2025 to see if the trend repeats. If bookings are coming in slower than last year, you may need to take a closer look at ADR and RevPAR.
2. Analyze ADR and RevPAR
ADR (Average Daily Rate) and RevPAR (Revenue Per Available Room) are key indicators for understanding past pricing performance and making data-driven decisions instead of relying on instinct.
For example: If last year’s ADR in July was $150, but this year bookings for that month are slow at the same rate, don’t immediately rush to lower prices. You still have time to test targeted strategies. A good approach could be to offer early bird promotions or, even better, bundle extra services into the rate to increase the perceived value and drive demand.
3. Monitor market trends
After assessing your current booking situation, the next step is to track competitor pricing trends in your area. This will help you identify peak demand periods.
For example: If you notice other hotels raising their rates for the second week of July, this could indicate a surge in demand that you can capitalize on immediately. For more on competitor monitoring, check out our guide on how to analyze hotel pricing and occupancy.
To learn more about how to monitor competitors, we recommend our article on how to analyze competitor hotel rates and occupancy.
4. Regularly optimize your prices
The steps above aren’t one-time actions—to maximize occupancy and revenue, you need to monitor historical data and market trends consistently (ideally daily) to adjust your pricing strategy in real time.
For example: At the end of April, demand is still low, so you continue using package deals and marketing efforts. But just a week later, in early May, as travelers return from spring break and start planning their summer vacations, demand could spike rapidly.
At that point, your previous strategy may no longer be effective—instead of relying on discounts, it may be time to increase prices to maximize revenue during the surge in demand.
How to use Smartpricing to forecast summer occupancy and optimize your strategy
The four-step method we just outlined is the only approach that guarantees the best results for the upcoming summer season. However, it requires consistency, well-organized data for easy comparison, and a significant amount of time.
If you lack one or more of these requirements, the best solution is to use a dynamic pricing and revenue management software like Smartpricing.
The reason is simple: by connecting Smartpricing to your property management system and channel manager, you can not only compare past performance but also automatically optimize a dynamic pricing strategy based on both your internal data and market trends. Let’s see how!
To compare your summer performance with the previous year, simply access the Dashboard. With just a few clicks, you can compare your forecast for summer 2025 with the forecast for summer 2024, meaning how summer 2024 bookings looked at this same time last year.
In the example shown in the screenshot, we’re comparing the 2025 situation (blue line on the graph) with the total summer bookings recorded as of March 11, 2024 (yellow line on the graph).
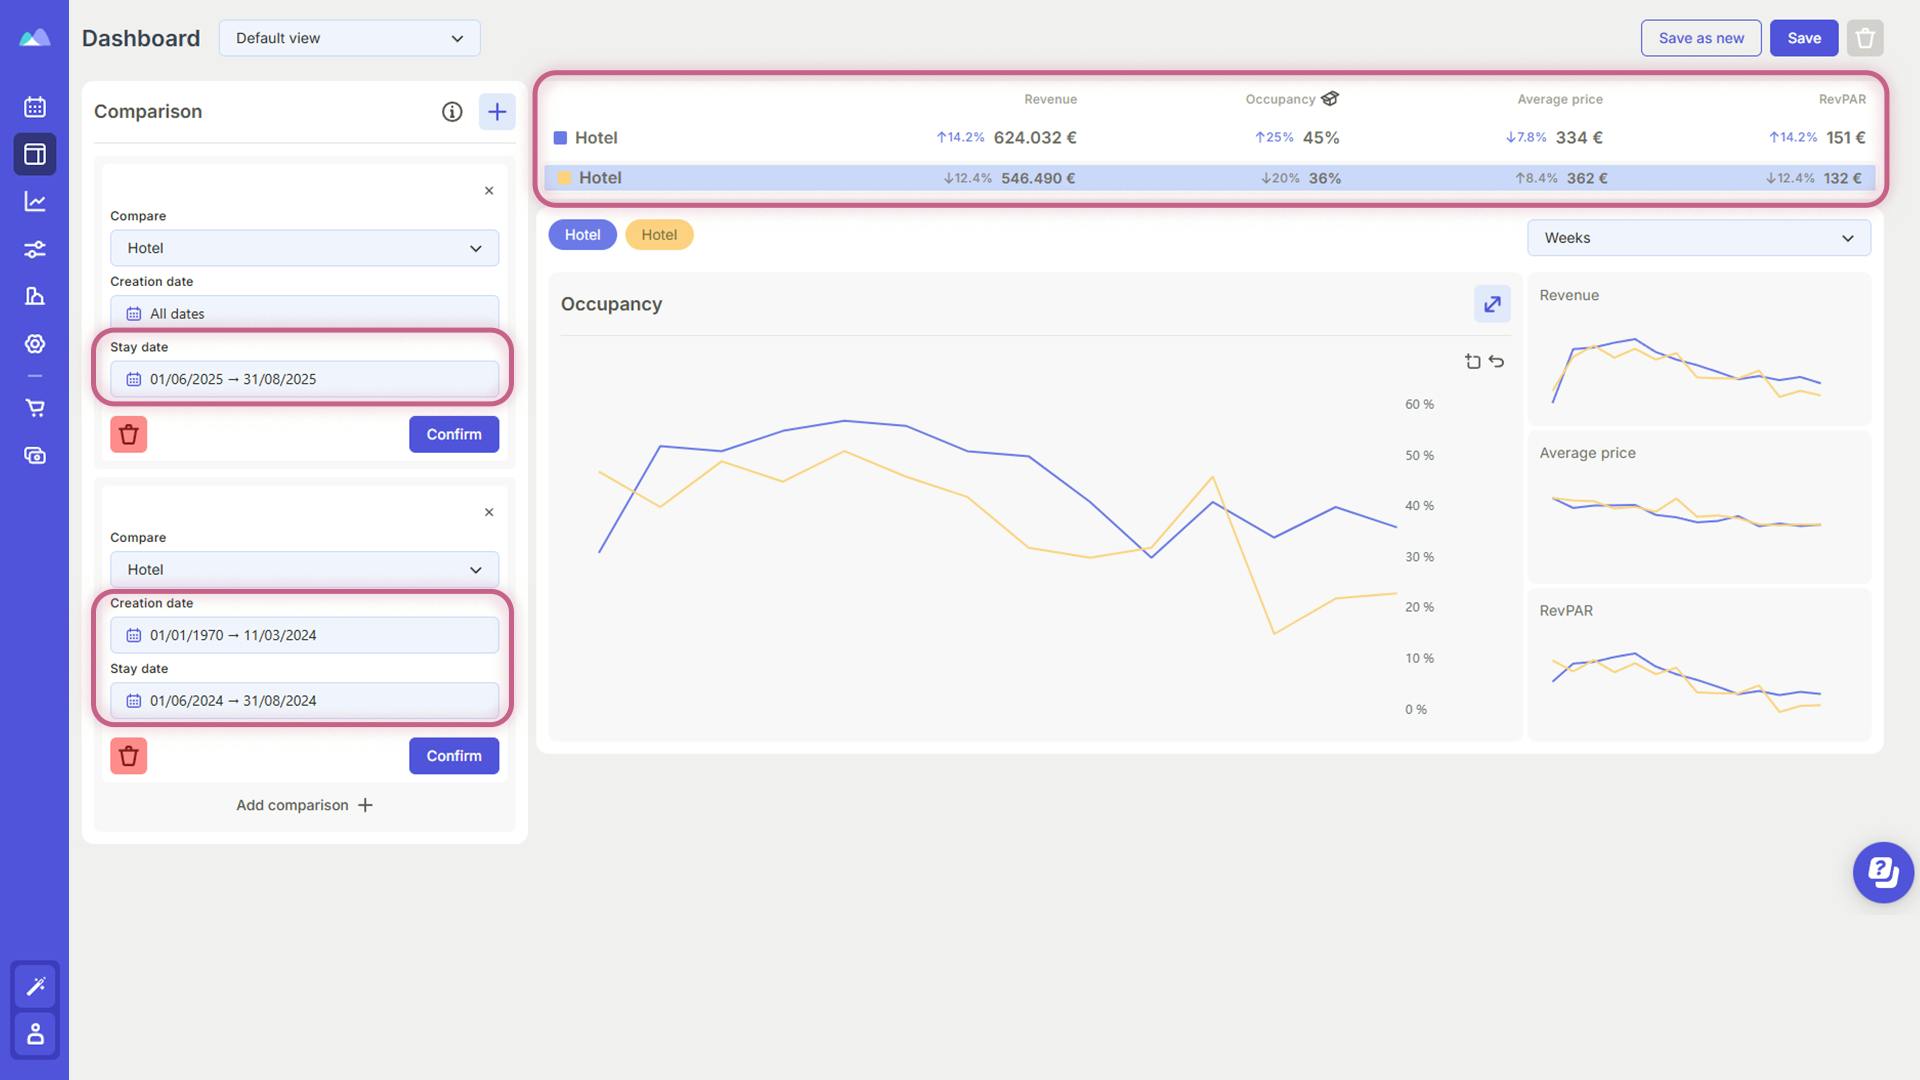
This comparison is crucial to determine whether your strategy is on track to meet expectations or if adjustments are needed.
Looking at the screenshot, you’ll find a comparison of key performance indicators (KPIs) at the top: Revenue, Occupancy, Average Daily Rate (ADR), and RevPAR (Revenue per Available Room). The data reveals that the property is performing well for summer 2025, with the only slight decline being in Average Daily Rate, which is offset by a 25% increase in occupancy compared to 2024.
Of course, this is just one of the potential scenarios that may arise after comparing your current data with historical trends. Let’s look at the three most common scenarios and how to adjust your pricing strategy accordingly.
3 common summer occupancy scenarios and how to adjust your rates
After analyzing your data, you may find yourself in one of three typical situations. Here’s what they are and how you can adjust your pricing strategy to ensure Smartpricing’s algorithm maximizes every revenue opportunity.
Scenario 1
Summer 2025 has lower occupancy compared to what was recorded in March 2024 for summer 2024.
What to do?
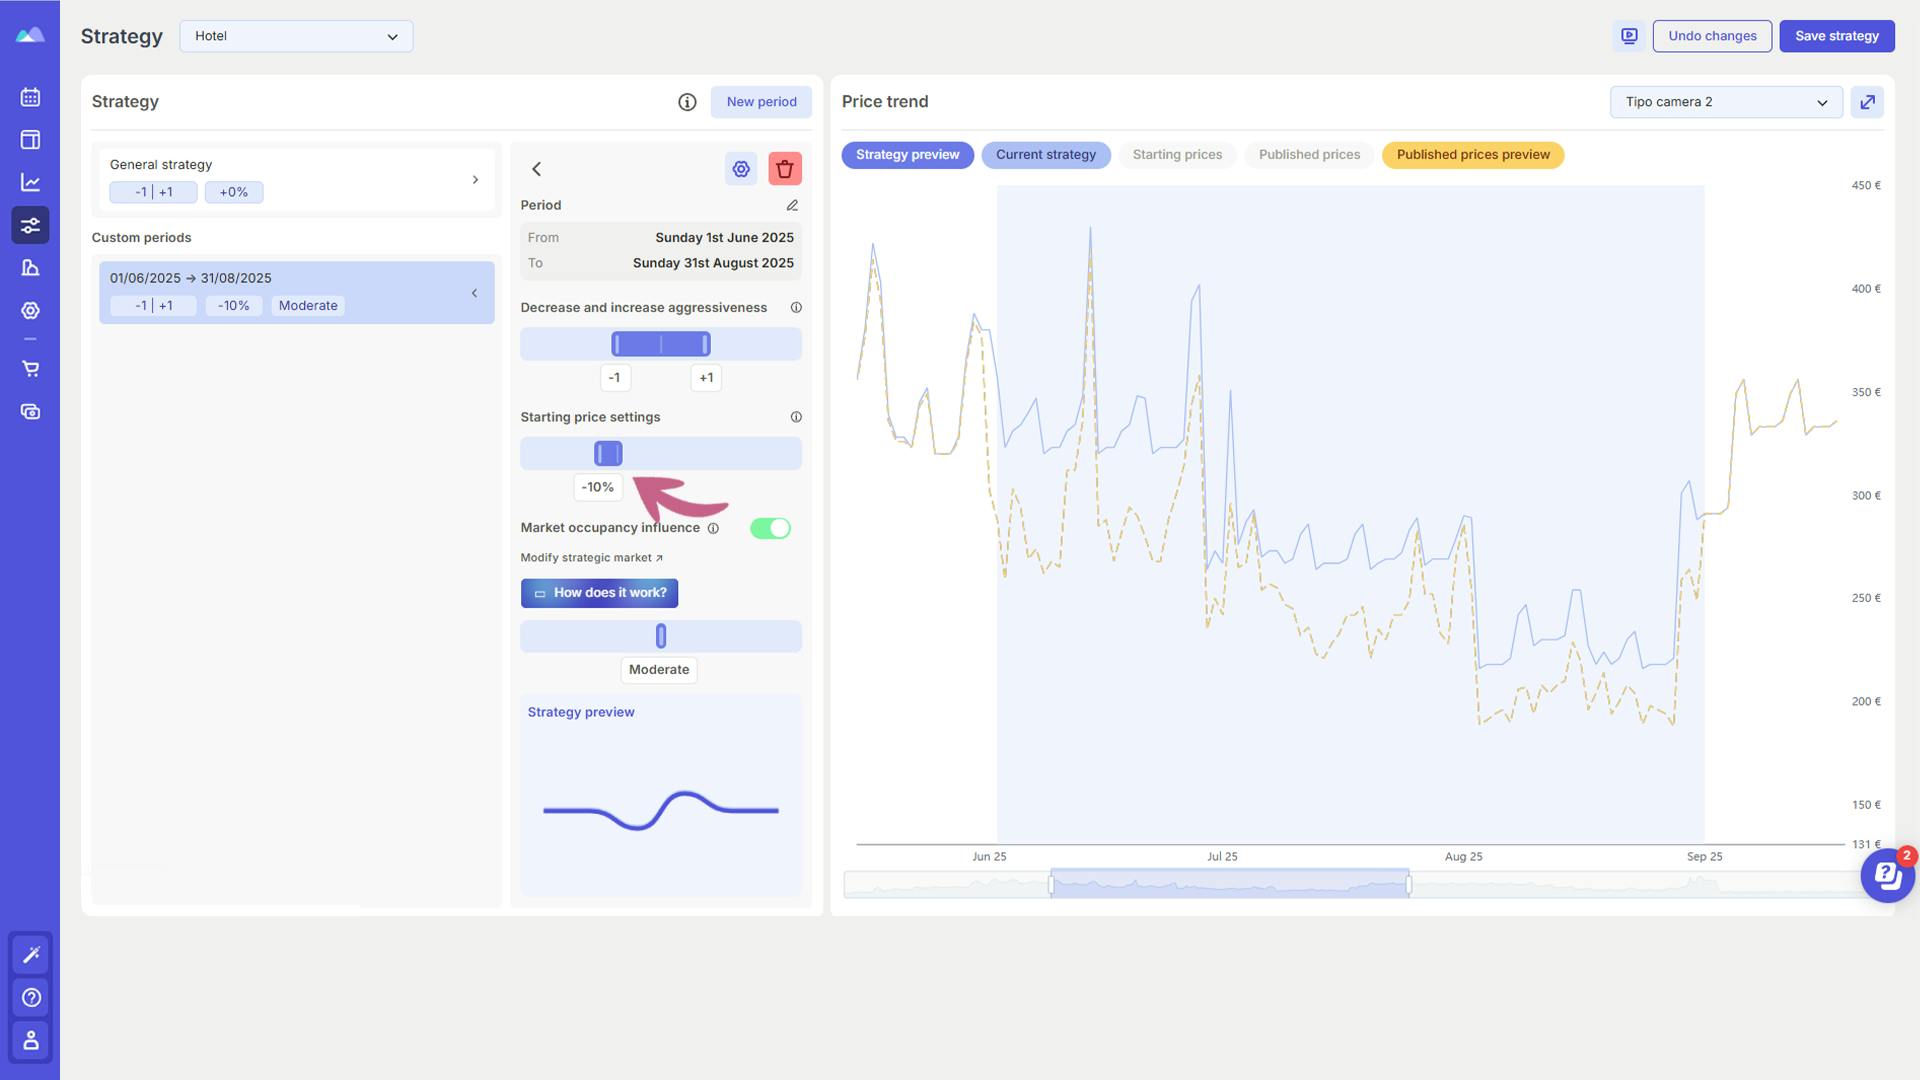
In this case, you might consider slightly lowering your base prices (the starting rates that the algorithm uses to calculate your real-time rates). In the screenshot below, we’ve applied a 10% decrease, reducing all base prices across different room types by 10%.
This allows the algorithm to start from a more competitive rate while still dynamically adjusting prices based on demand fluctuations. If demand increases, the algorithm will gradually raise prices to maximize revenue—without requiring any manual intervention from you.
When making these adjustments, always remember to set a minimum price threshold that the algorithm should not go below. You can do this in the Calendar section using the "Modifiers" feature.
Scenario 2
Summer 2025 has slightly or significantly higher occupancy compared to what was recorded in March 2024 for summer 2024.
What to do?
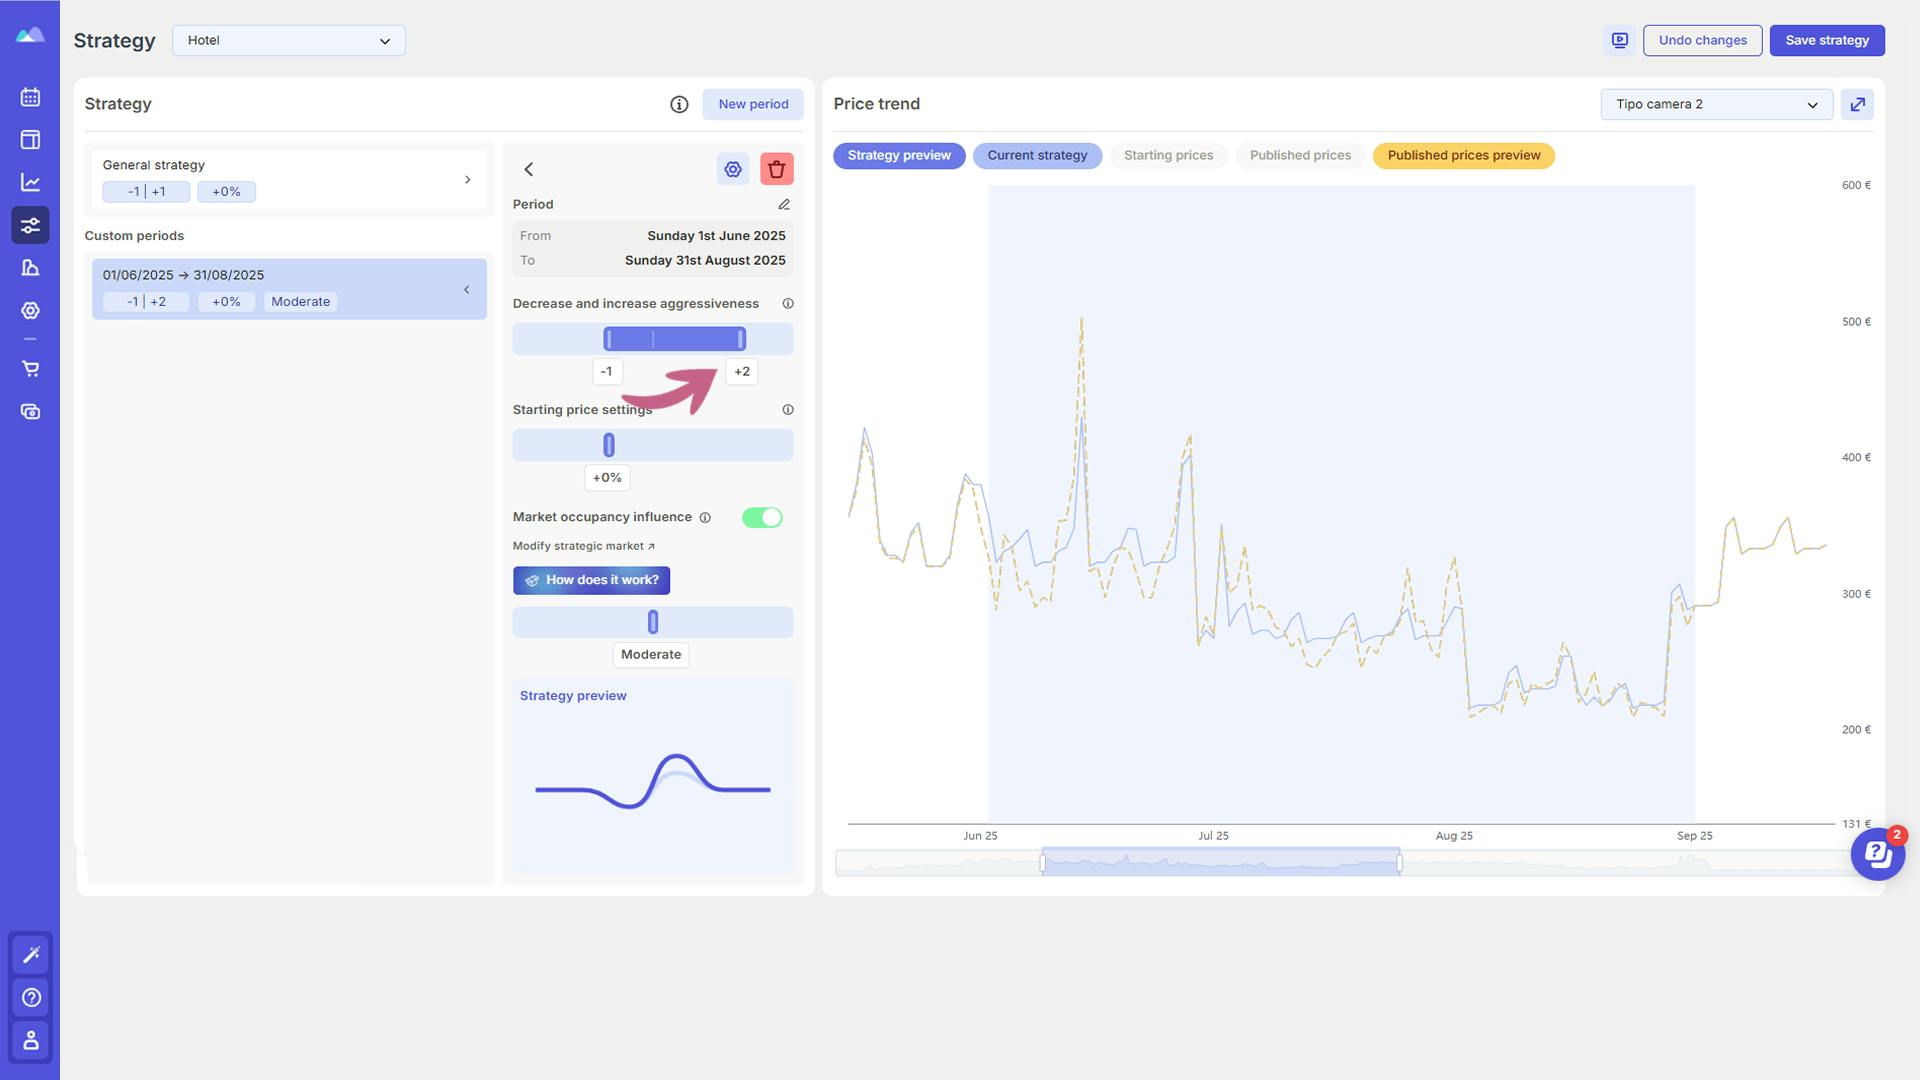
If projected occupancy for 2025 is slightly higher, you might consider adjusting the pricing aggressiveness by increasing it as occupancy rises.
To do this, simply adjust the aggressiveness slider for price increases and decreases, as shown in the screenshot below. This ensures that the algorithm responds quickly to demand surges, gradually increasing prices to maximize revenue while minimizing the risk of losing bookings.
If projected occupancy is significantly higher, in addition to increasing price aggressiveness, you may want to raise your base prices. Starting from a higher base price, the algorithm will help you maximize revenue from strong demand more quickly.
Again, using the "Modifiers" available in the Calendar section, be sure to set a maximum price that you do not want the algorithm to exceed.
Scenario 3
Summer 2025 has the same occupancy levels as those recorded in March 2024 for summer 2024.
What to do?
If occupancy is in line with last year's levels, the best way to determine your next steps is by looking at your ADR (Average Daily Rate).
- If ADR 2025 is the same as ADR 2024, you can remain in observation mode.
- If ADR 2025 is lower (as seen in the first screenshot in our example), you can implement one of the two strategies from Scenario 2, depending on how much ADR has decreased.
- If ADR 2025 is increasing, you can apply the Scenario 2 method (raising price aggressiveness).
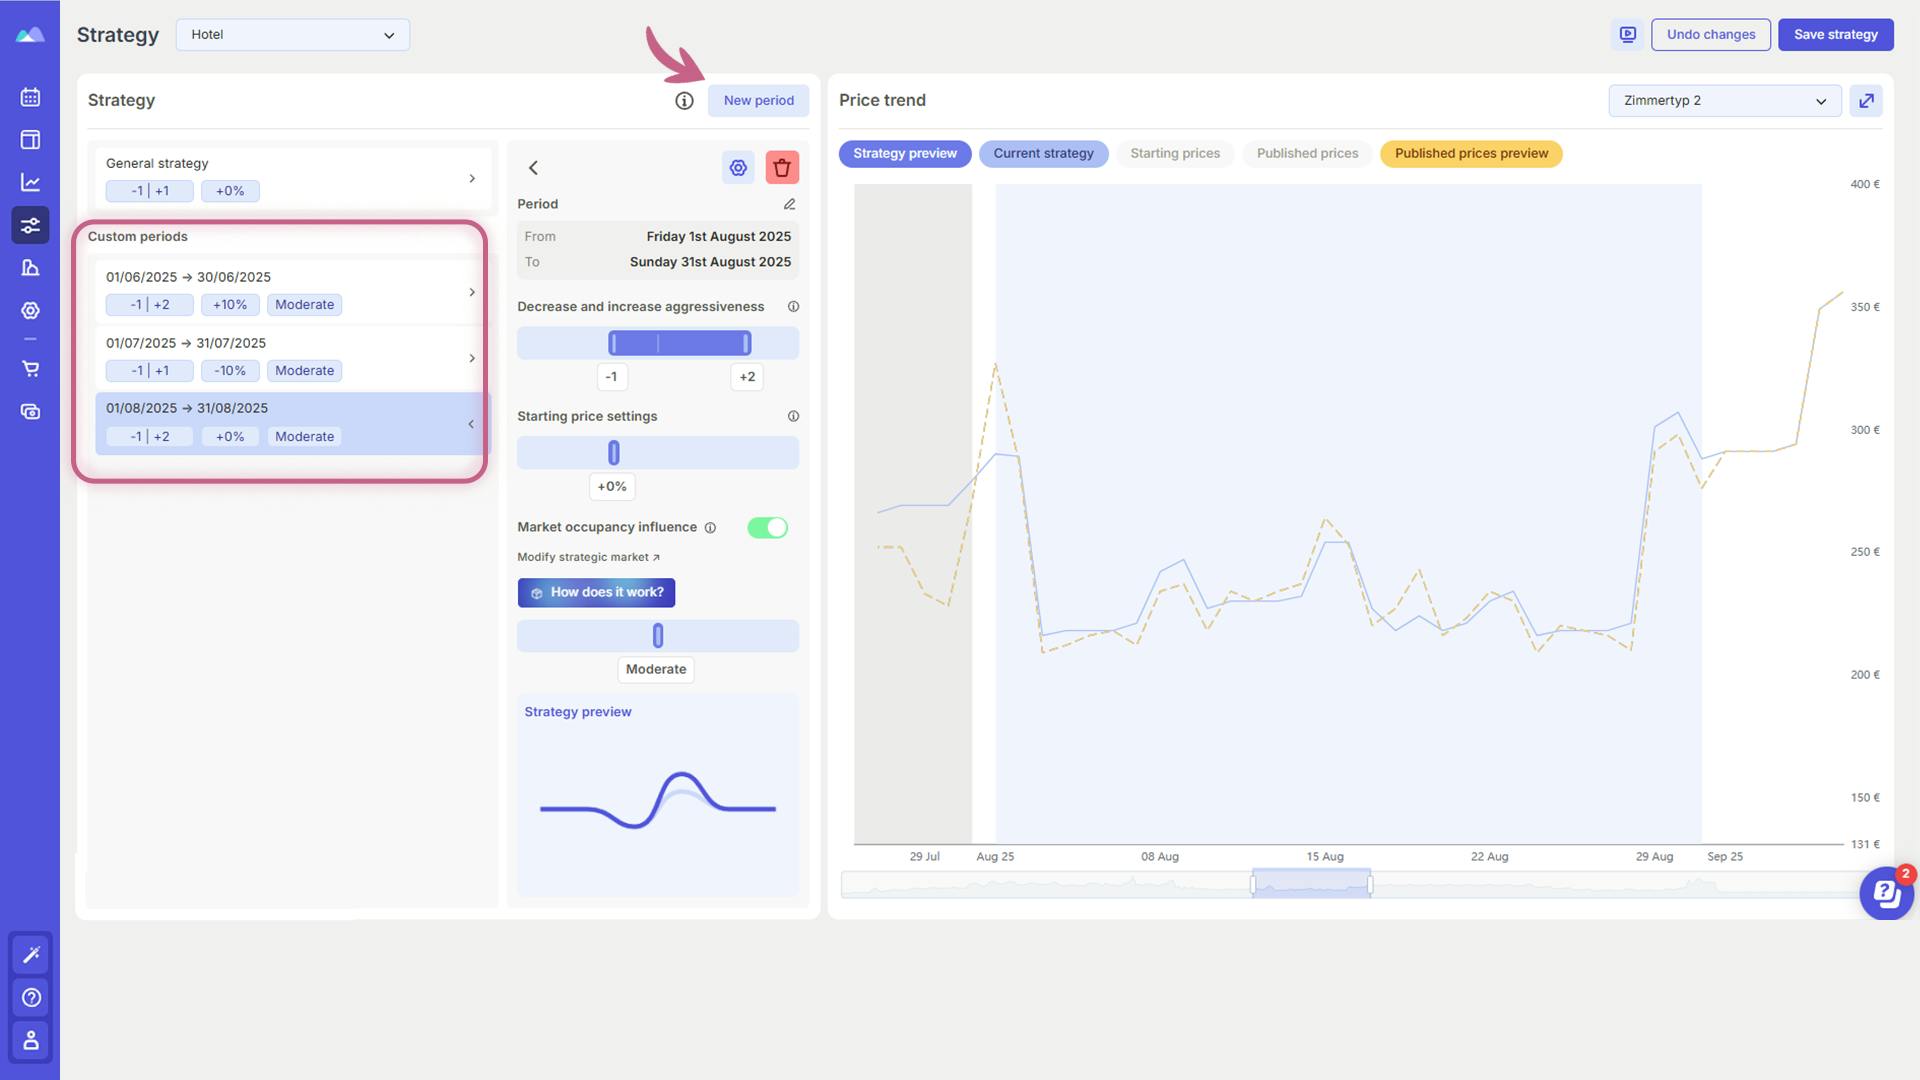
These three scenarios may also overlap: for example, you might see growth in June, a decline in July, and stability in August.
In this case, instead of setting your strategy for the entire summer period (June 1 - August 31), you should create three separate pricing periods. This way, the algorithm will apply different pricing rules based on the specific time in the season.
How to use Smartpricing to monitor current market trends
In the occupancy scenario examples, we assumed a +/-10% adjustment to base prices. But how do you determine the right percentage?
To ensure an appropriate increase or decrease, you should check market occupancy levels to adjust your pricing accordingly and align with your market segment.
Once again, Smartpricing eliminates the need for lengthy and complex manual analysis. In the Market Analysis section, simply select the period you want to analyze and choose the "occupancy" option. This will provide you with the maximum and minimum market occupancy averages.
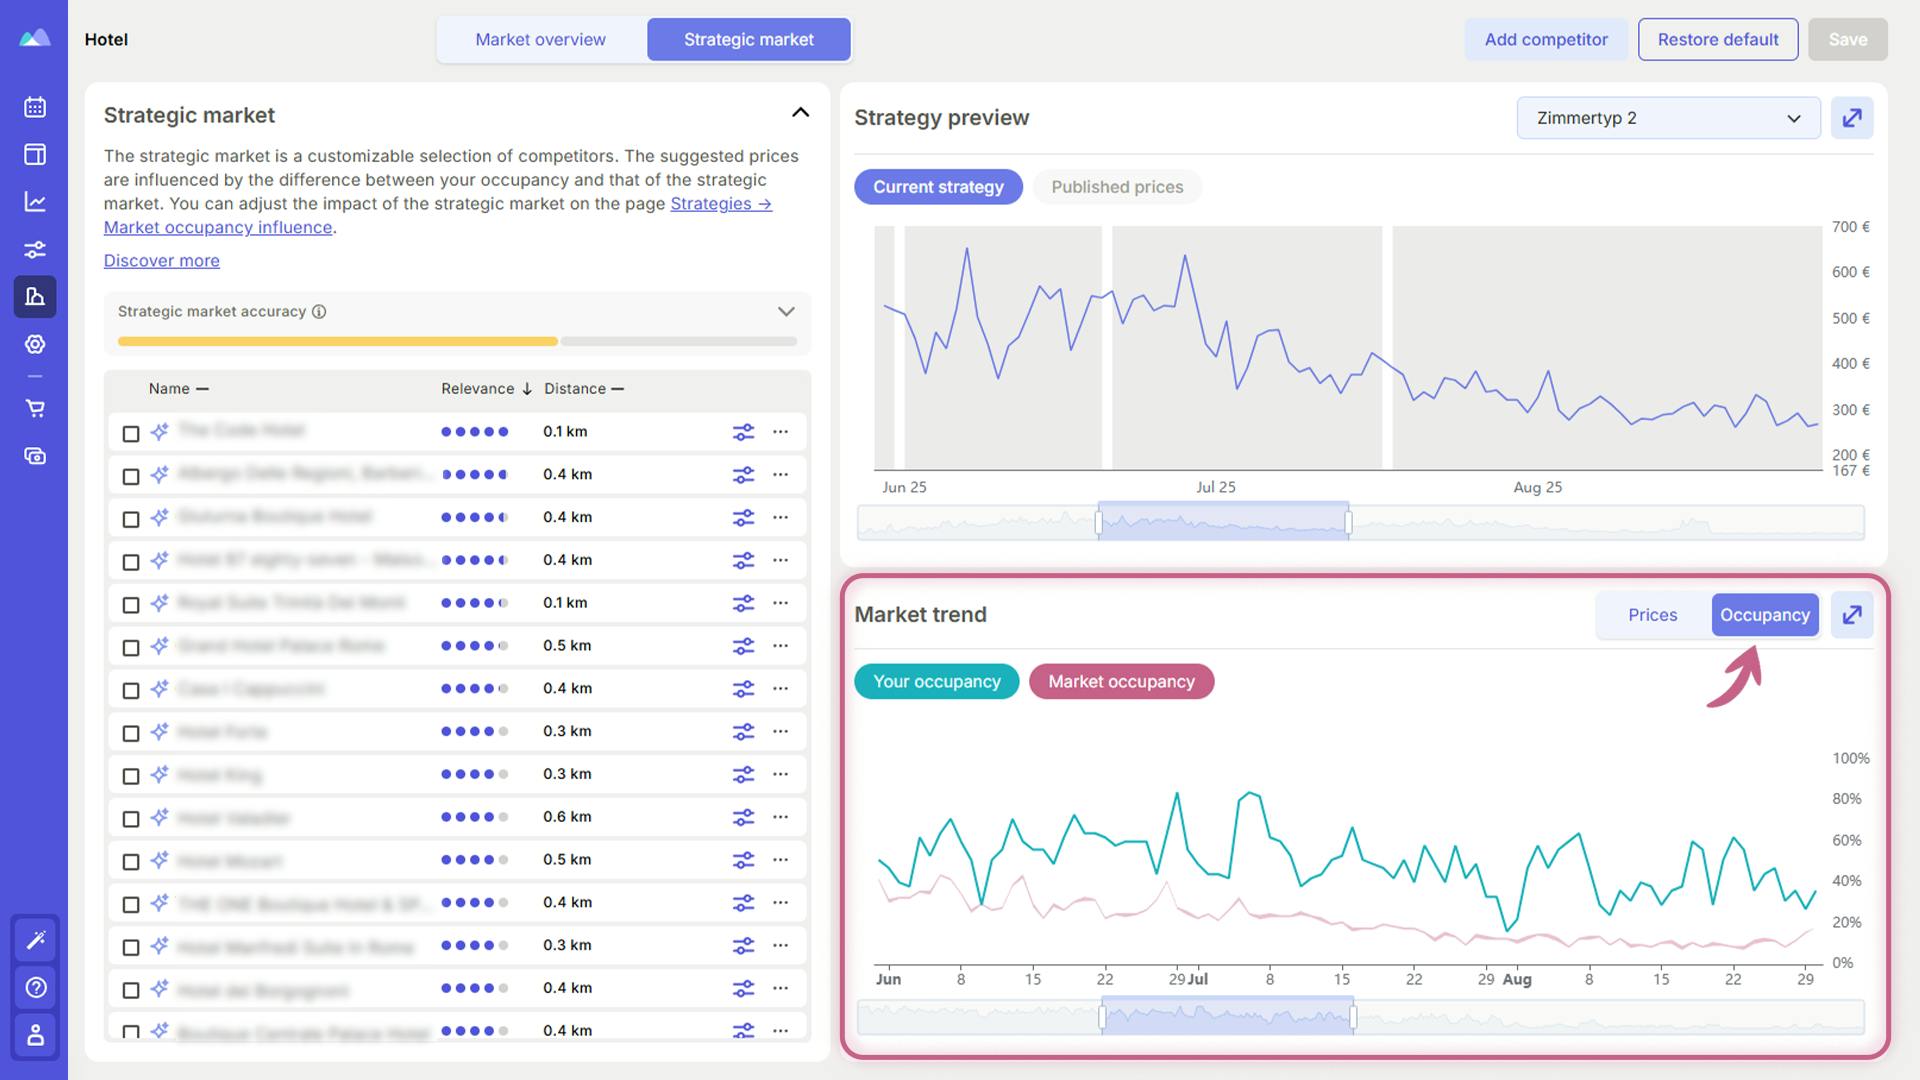
Of course, you don’t necessarily have to align with the market: If your occupancy is higher than last year's and also above the market average, you may want to price above competitors. If your occupancy is lower than last year's and also below the market average, you may consider pricing below the average to attract additional bookings.
The tasks outlined in this article take just a few minutes of your day. After that, you’ll be free to focus on other strategic activities for your property, knowing that Smartpricing’s algorithm will continuously monitor key variables and optimize your summer pricing strategy in real time.
Likewise, you won’t have to manually update price adjustments on your PMS or Channel Manager anymore—Smartpricing will automatically sync all changes across your distribution channels.
Want to see how Smartpricing works and how much additional revenue it could generate for you? Request a free, personalized demo today.
The Smartpricing Team